A 1528-1603 Nm Ase Source can support fiber sensing, component testing, and optical-system characterization across a broad wavelength span. That span reaches from the conventional C-band region into the L-band region, so a source’s stated range alone does not guarantee uniform performance. Check the actual output spectrum, not just the label. Small details matter: a ripple near one wavelength can affect a measurement even when the overall power looks adequate.
Growing connectivity helps explain the need for dependable optical test equipment, but it does not define a source’s specifications. The ITU’s Facts and Figures 2023 estimated that 5.4 billion people were using the internet worldwide. Cisco’s Annual Internet Report (2018–2023) had forecast global IP traffic of 396 exabytes per month by 2022; this was a forecast, not a current measurement. These reports provide useful context, not proof that one ASE model suits every application. For practical selection, compare usable bandwidth, spectral flatness, output power, stability, and fiber-interface requirements. Also check how performance is specified and measured. ITU-T Recommendation G.694.1 provides a reference for DWDM frequency grids, but it does not replace a product’s test data. The hard part is matching that data to your setup. A careful comparison can prevent costly surprises, though some trade-offs remain. This guide outlines five checks to make before choosing a source.
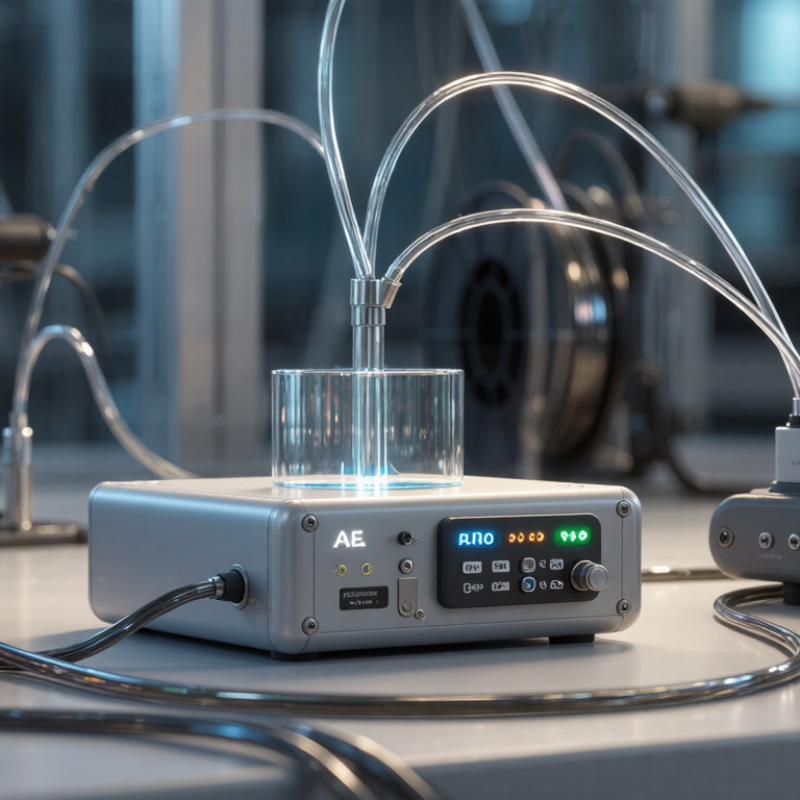
A 1528–1603 nm ASE source does not sit entirely inside the conventional C- and L-band definitions. The commonly used C-band span is about 1530–1565 nm; L-band extends roughly from 1565 to 1625 nm. So this source begins just below the usual C-band edge, crosses the C/L boundary, and ends within L-band. The edge matters. A test setup labeled “C+L” may still need to account for output near 1528 nm.
In frequency terms, 1528–1603 nm is approximately 196.2–187.0 THz. ITU-T G.694.1 defines DWDM frequency-grid spacing, including 100 GHz spacing; near 1550 nm, that is about 0.8 nm between channels. This is useful context, not a guarantee that an ASE spectrum will be flat or channel-aligned. Check the measured spectrum, power density, and ripple across the full wavelength span, especially around 1565 nm. A small mismatch can be easy to miss. The band boundary itself is a convention, and I would verify the supplier’s stated measurement limits rather than assume every instrument uses the same cutoff.

For a 1528–1603 nm ASE source, spectral flatness should be judged across the entire 75 nm span, not from a smooth-looking center section. Edge behavior matters. A spectrum that appears even near 1565 nm may still roll off near either endpoint. Compare the maximum and minimum power spectral density across the specified band, and note the measurement resolution and test conditions. A plot without these details is hard to evaluate.
Tip 1:
Check both endpoints and several points between them.
Tip 2:
Compare ripple and tilt using the same analyzer settings, resolution bandwidth, and temperature.
Tip 3:
Repeat the measurement after warm-up. Small setup changes can shift the result. Keep records. This sounds fussy, but it helps separate source behavior from measurement variation.
Match the flatness requirement to the application’s usable wavelength range; a tighter specification is not automatically better if only part of the band is needed. Ask for measured data across 1528–1603 nm, including stated limits and test conditions. If possible, inspect raw traces rather than relying only on a single flatness figure. I would not assume a perfectly level spectrum, either; real measurements include uncertainty, and that deserves a note.
An ASE source covering 1528–1603 nm should be chosen for the receiver’s usable band, not its headline output alone. Build the link budget from launch power, then subtract fiber, connector, splice, filter, and receiver losses. ITU-T Recommendation G.652 gives a maximum attenuation coefficient of 0.30 dB/km at 1550 nm for specified single-mode fiber. On a 20 km path, that can mean 6 dB of fiber loss before connectors. Small losses add up. Leave margin for temperature changes, aging, and repairs.
Tip: Compare minimum guaranteed output power with the worst-case link budget, not nominal power. Check power stability across the operating-temperature range and spectral flatness across the full source band. A steady total-power reading can hide a dip near the receiver’s wavelength.
Tip: Ask for drift measurements, warm-up time, and measurement uncertainty. If stability data only covers room temperature, the picture is incomplete. Test the source with the actual filters and fiber where possible; lab setups can make a link look better than it is. ITU-T G.652 provides the fiber attenuation reference.
For a 1528–1603 nm ASE source, treat 50 GHz as a measurement reference, not a discrete-channel guarantee. At 1550 nm, 50 GHz corresponds to about 0.40 nm in wavelength. The equivalent interval changes across the band: it is slightly narrower near 1528 nm and wider near 1603 nm. Small detail, real consequence.
Tip: Compare usable spectral power across the full range, then check the spectrum with resolution fine enough to distinguish features about 0.40 nm apart near 1550 nm. A coarse analyzer can blur ripple into an apparently smooth trace. Confirm whether the stated bandwidth means a 3 dB width, a flatness range, or merely detectable output. These are not interchangeable.
Tip: Ask for power density, ripple, and stability data under stated operating conditions. If your setup uses 50 GHz filters, verify passband alignment and guard margins rather than matching numbers on paper. Real filters have edges, and connectors add loss. A single scan can mislead, so repeat it after warm-up and record the settings. It takes extra time, but the check is worthwhile.
5 Tips for Choosing a 1528–1603 nm ASE Source
An ASE source covering 1528–1603 nm can suit testing across a broad telecom band, but its OSNR needs context. Compare the stated value at the wavelength and output power your setup will use. Check the measurement resolution bandwidth and reference level; different settings can make similar sources look surprisingly different. Ask for a spectral trace, not just one headline figure. Small dips may matter.
Polarization deserves equal attention. Determine whether the output is unpolarized, polarization-maintaining, or simply specified by a degree of polarization. For polarization-sensitive components, confirm stability over time and temperature, then test at the actual fiber output. A quick bench check helps. Still, a single reading may miss drift, especially after warm-up or fiber movement.
Match the interfaces to your equipment: fiber type, connector format and polish, optical power range, and any electrical control or monitoring ports. Inspect connector end faces and avoid mixing incompatible polish types. Confirm whether the stated output power applies across the full band or only at a particular wavelength. Datasheets can leave this unclear. That detail is easy to overlook, and it may change how you plan calibration and coupling losses.
